iklan

Showing posts with label Indicators. Show all posts

Wednesday, May 16, 2018

Currency Strength Meter - indicator for MetaTrader 4

Currency Strength Meter indicator gets RSI (Relative Strength Index) values from four different instruments of your choice and displays them in indicator window.

Features:

  • Ability to set custom colors and styles for each instrument.
  • Displays colored labels for instrument identification.
  • You can adjust period and applied price.
  • Supports all types of markets (Forex, Commodities, Indices, Crypto Currencies etc.).

Inputs:
  • instrOne - instrument 1.
  • instrTwo - instrument 2.
  • instrThree - instrument 3.
  • instrFour - instrument 4.
  • colorOne - instrument 1 color.
  • colorTwo - instrument 2 color.
  • colorThree - instrument 3 color.
  • colorFour - instrument 4 color.
  • indicatorPeriod - indicator period.
  • appliedPrice - indicator applied price.


DOWNLOAD

Momentum Histo - indicator for MetaTrader 4

This indicator is based on code from the original author Iurii Tokman. I translated it from Russian and made the following improvements:


  • Added trading alerts (Alerts in MetaTrader 4 terminal, Email notifications, Push notifications).
  • Inputs to enable/disable each alert type separately.
  • Instead of only Momentum, implemented a drop-down list of indicators you can choose from.
  • Minor optimizations and fixes.

Inputs
MName - indicator name.
MPeriod - indicator period.
MLevel - indicator level.
MAppliedPrice - applied price for Momentum, CCI or RSI.
Alerts - enable/disable alerts.
Email - enable/disable Email notifications.
Push - enable/disable Push notifications.


DOWNLOAD

RSI with divergency - indicator for MetaTrader 4

Regular RSI, but it will show the divergency or the convergency between the 2 last peaks.
You can choose the icon's size as well as the excess limits.


DOWNLOAD

Friday, December 30, 2016

Vortex Indicator MT4

Inspiration

The Vortex Indicator was inspired by the work of an Austrian inventor, Viktor Schauberger, who studied the flow of water in rivers and turbines. Etienne Botes and Douglas Siepman developed the idea that movements and flows within financial markets are similar to the vortex motions found in water. The Vortex Indicator was also partly inspired by J. Welles Wilder's concept of directional movement, which assumes the relationship between price bars gives clues as to the direction of a market.

Description

A vortex pattern may be observed in any market by connecting the lows of that market’s price bars with the consecutive bars’ highs, and then price bar highs with consecutive lows. The greater the distance between the low of a price bar and the subsequent bar’s high, the greater the upward or positive Vortex movement (VM+). Similarly, the greater the distance between a price bar’s high and the subsequent bar’s low, the greater the downward or negative Vortex movement (VM-).

A Vortex Pattern in the Market: By connecting the lows of price bars with the consecutive bars’ highs, and then price bar highs with consecutive lows, one can observe a vortex pattern in the market.
The Vortex Indicator: The greater the distance between the low of a price bar and the subsequent bar’s high, the stronger the positive vortex movement (VM+). Similarly, the greater the distance between a price bar’s high and the subsequent bar’s low, the stronger the negative vortex movement (VM−).

Identifying a trend

On a chart, VI+ and VI− will be seen to intersect each other at a change of trend, and begin to diverge ever wider as the strength of a trend increases. When VI+ is larger and above VI−, the market is trending up. Conversely, when VI− is bigger and above VI+, the market is trending down.
A trader should focus on the key trend change points of the Vortex Indicator (i.e. the crossing points of VI+ and VI−). When VI+ crosses above VI−, a long (buy) position is indicated. A short or sell position is suggested when VI− crosses above VI+.
The published article also suggested further measures to ensure an effective trading strategy, for example, only entering a trade at the extreme high or low of the price bar that corresponds with a crossing of the Vortex Indicator.
14-period daily vortex indicator: When VI+ is greater than VI−, it indicates that the market is trending up. The market is trending down when VI− is above VI+. The potential change of trend points are found where VI+ and VI− intersect one another.
Price chart: As the trend strengthens, notice how the VI+ and VI− lines increasingly diverge. As the trend weakens, you will observe the two lines converging again.

Calculation

The high, low and close values are required for any chosen stock, future, commodity or currency. These values may be 15-minute, hourly, daily, etc.
  • First, calculate the current true range:
    • Current true range (TR) = Maximum absolute value of either (current high–current low), (current low–previous close), (current high–previous close)
  • Next, calculate the current upward (positive) and downward (negative) vortex movements:
    • Current Vortex Movement Up (VM+) = absolute value of current high – previous low
    • Current Vortex Movement Down (VM−) = absolute value of current low – previous high
  • Decide on a parameter length (21 periods was used for this example). Now, sum the last 21 period’s True Range, VM+ and VM-:
    • Sum of the last 21 periods’ True Range = SUM TR21
    • Sum of the last 21 periods’ VM+ = SUM VM21+
    • Sum of the last 21 periods’ VM- = SUM VM21−
  • Finally, divide SUM VM21+ and SUM VM21− respectively with the SUM TR21 to obtain the Vortex Indicator:
    • SUM VM21+/SUM TR21 = VI21+
    • SUM VM21-/SUM TR21 = VI21−
If this process is repeated, the resulting VI21+ and VI21− can be drawn graphically to represent the two lines of the Vortex Indicator.

Practical application

The Vortex Indicator is simple to use as the only required inputs are the high, low and close of a price bar. Traders may use the Vortex Indicator on its own, in combination with other technical indicators to confirm a change of trend or as part of a larger trading system.
In addition, the Vortex Indicator may be used for any:
  • market (such as stocks, futures or currencies)
  • time frame (for example, 15 minute, hourly or weekly charts)
  • parameter (such as 13, 21 or 34 periods)
The inventors of the Vortex Indicator recommend using longer time frames and parameters in order to filter out false signals. If a trader does opt to use a very short time frame, such as 5 minutes, this should be combined with a long parameter of 34 or 55 periods.
Because of its universal applicability, the Vortex Indicator is suitable for both short term traders as well as longer term fund managers who may wish to identify larger macro trends within a market.

Coding and strategies

The Vortex Indicator is available on most charting software. Some of these companies have suggested additional trading strategies to use in conjunction with the Vortex Indicator, including the implementation of a trailing stop and making use of supporting indicators in order to reduce the number of false signals.

Comparative studies

To test the Vortex Indicator against Welles Wilder’s directional movement indicator (DMI), a portfolio of 38 of the most actively traded, full sized, futures contracts was created. These 38 futures included a number of index and financial futures, currencies, metals, energy futures and commodities like grains, oils and foods. The test period was from 3 January 1978 to 6 November 2009, using a 14-day parameter for both indicators. Over the entire test period, and also during the last 10 years, the Vortex Indicator showed a better performance than the DMI.[7]
However, using a similar test based on 101 NASDAQ stocks, on a smaller sample (for the period 2 January 1992 to 14 August 2009), the DMI showed a better performance than the Vortex Indicator.

Monday, August 29, 2016

FFC - Forex Factory Calendar - indicator for MetaTrader 4

Description:

This is a modified version of the popular news indicator FFCal which was published initially by DerkWehler to ForexFactory forum. Actually, I've modified the code to suit my needs but I found that it may be useful for others as well so I decided to share it. I have rewritten the indicator so you can consider it almost "build from scratch" of the original. Yet, it shares the same techniques and main style.
The indicator places a panel on your chart that shows 5 economic events listed on the Forex Factory Calendar. You can filter out/in the events of High, Medium, or Low impact, Speaks, Holidays or by specific keyword filter. Please see all modifications listed below.
Also, the indicator can be called within an EA using the iCustom() function by accessing 2 buffers:
  • Buffer (0) contains minutes until the most recent event.
  • Buffer (1) contains impact value for the most recent event (Low = 1, Medium = 2, High = 3).
You can call buffers in two ways:
Simple call: (default values will be applied)
int EventMinute = (int)iCustom(NULL,0,"FFC",0,0);
if(EventMinute == 30) { .. YOUR CODE .. } // 30 minutes before the event

int EventImpact = (int)iCustom(NULL,0,"FFC",1,0);
if(EventImpact == 3)  { .. YOUR CODE .. } // High impact event
Advanced call:
iCustom(
        string       NULL,            // symbol
        int          0,               // timeframe
        string       "FFC",           // path/name of the custom indicator compiled program
        bool         true,            // true/false: Active chart only
        bool         true,            // true/false: Include High impact
        bool         true,            // true/false: Include Medium impact
        bool         true,            // true/false: Include Low impact
        bool         true,            // true/false: Include Speaks
        bool         false,           // true/false: Include Holidays
        string       "",              // Find keyword (case-sensitive)
        string       "",              // Ignore keyword (case-sensitive)
        bool         true,            // true/false: Allow Updates
        int          4,               // Update every (in hours)
        int          0,               // Buffers: (0) Minutes, (1) Impact
        int          0                // shift
        );
*Please note that the indicator does not have (at this stage) back-testing capabilities.

Suggested style:

  • High Impact color = C'217,83,79'
  • Med Impact color = C'255,185,83'
  • Low Impact color = C'91,192,222'
  • Holidays color = clrOrchid
  • Remarks color = clrDimGray

Calendar legend:

  • m/m: Month Over Month
  • q/q: Quarter Over Quarter
  • y/y: Year Over Year
  • K Thousand
  • M Million
  • B Billion
  • T Trillion

Images:

FFC 1
FFC 2
FFC 3

Modifications:

  1. Added: #property strict for compatibility with MetaTrader 4 Build 600+ and better code quality.
  2. Added: Show event Previous/Forecast impact (colored impact).
  3. Added: Option to show events related to active chart only (override other parameters)
  4. Added: Keyword filter. Find or Ignore a specific one word, i.e. "NFP", will filter out all events with/without only that word. (case-sensitive)
  5. Added: Option to show currency strength / bar time left / spread value.
  6. Added: Option to control the time for display of past events (in minutes).
  7. Added: Option to set panel location in 4 chart corners.
  8. Added: Tool-tip on mouse hover that shows event title, impact and event time left.
  9. Added: Panel title. You can use it as a reminder note :)
  10. Modified: Show event in "Date/Time format" instead of minutes left (you can show minutes left through Tool-tip)
  11. Modified: Vertical lines for the upcoming events. (You may need to modify the "time offset" input depending on your broker time).
  12. Modified: Buffers that holds the upcoming event minute and impact (see examples above)
  13. Modified: Revised order of External Inputs.
  14. Improved: Replaced DownLoadWebPageToFile() function with native Windows URLDownloadToFileW() function.
  15. Improved: Placed (download/read XML file) and related codes into a functions so we can call them when needed.
  16. Improved: Replaced "GlobalVariables" that used to update XML file with FILE_MODIFY_DATE - OnTimer() set by "AllowUpdates", "UpdateHour" inputs.
  17. Improved: Time GMT offset, now the events will show in your local time automatically.
  18. Improved: Justify the panel/text when set to right/left.
  19. Improved: Alert function, Now it will send beside the Popup Alert: sound alert, Push notification on your phone and Emails. (two separate alerts)
  20. Improved: Code quality, now the indicator is lighter and faster than ever.
  21. Fixed: Various bug fixes, some unnecessary/unused codes or variables removed, placed some variables inside their related functions.

Real Authors:

Credit:


* In order to use this indicator, you need to turn on DLL Imports in your MetaTrader 4 platform options.
* Please be aware that the code may have some bugs or other flaws, so if you see any bugs or suggestions, or even better code practice, please let me know.
* According to Forex Factory website, all event times are approximate and subject to change.

Sunday, August 7, 2016

Regression Channel - indicator for MetaTrader 4

Author: KimIV

The Regression Channel didasarkan pada Linear Regression Trend, yang merupakan garis tren yang biasa diplot antara dua titik pada grafik harga dengan menggunakan metode kuadrat terkecil. Akibatnya, baris ini terbukti menjadi garis tengah yang tepat dari perubahan harga. Hal ini dapat dianggap sebagai garis harga ekuilibrium, dan setiap defleksi ke atas atau bawah menunjukkan peningkatan aktivitas pembeli atau penjual, masing-masing. 

Baca di sini .


SHI SilverTrendSig - indicator for MetaTrader 4

Author: VIAC.RU, OlegVS, GOODMAN, 2005 Shurka
The indicator generates buy and sell signals.


Demark Lines - indicator for MetaTrader 4

Versi saya memplot garis DeMark, juga menarik saluran selain garis tren dan target. Ditambahkan satu sasaran lebih (yang ketiga didefinisikan sebagai 1,62 dari ekstrem dalam), menambahkan pembatalan sinyal saat menutup dalam saluran.


Deskripsi parameter dalam kode, jika ada yang tertarik, mereka bisa mencari tahu.


AutoFibo - indicator for MetaTrader 4

Indicator that automatically draws Fibo Retracement.

Indicator uses ZigZag for drawing.


The Cronex T RSI GF indicator - indicator for MetaTrader 4

Modifikasi indikator RSI

Perubahan:

Berubah jumlah dimensi (khusus untuk menyederhanakan digunakan dalam ahli)
Garis indikator utama terdiri dari 4 dengan periode pergeseran
Ditambahkan garis perataan berdasarkan T3 (saya tidak ingat yang algoritma itu)
Sinyal yang dipindahkan ke buffer terpisah
Ditempatkan BB di T3 untuk meningkatkan kejelasan perubahan
Jangan menggunakannya sebagai alat perdagangan mandiri, ia dirancang untuk konfirmasi indikator tren.

Jika membantu orang untuk membuat keuntungan, sumbangan diterima :-)


Strategy Tester Equalizer - indicator for MetaTrader 4

Deskripsi:
Indikator ini memungkinkan untuk mengontrol kecepatan Strategi Tester.

Anda dapat memperlambat atau mempercepat kecepatan Strategi Tester ketika diatur ke 32.
  • Kecepatan : kecepatan penurunan (kurang atau sama dengan nol)
  • Lewati Tick : peningkatan kecepatan (lebih besar atau sama dengan nol)
  • Langkah : Interval (lebih besar atau sama dengan satu)

Gambar:

input

Pemakaian

Video:

Persyaratan:
Diperiksa ' Izinkan impor DLL ' sebelum menjalankan indikator.

MACD and Volumes - indicator for MetaTrader 4

Deskripsi:
Indikator ini telah dilakukan untuk mengetahui MACD divergenсe \ convergenсe dan mismath antara harga dan volume.

Penuh garis fungsional MACD dan histogram, dan Anda dapat menonaktifkan menunjukkan volume kapanpun Anda inginkan.

Gambar:
MACD dan Volume

HarmonikManual new version - indicator for MetaTrader 4

Penulis nyata:
Saya telah dimodifikasi dan dikombinasikan bahan-bahan berikut:

Harmonik_Ratios oleh "semua pedagang";
Mendukung dan Resistance Barry Stander;
program saya sendiri.

Deskripsi:
Ini adalah versi perbaikan dari "HarmonikManual" , dengan lebih menarik dan lebih mudah digunakan.

Indikator ini dibuat dengan tujuan untuk:

Mendeteksi nama pola titik-titik yang kita tempatkan;
Menemukan kemungkinan pola yang muncul;
menemukan kemungkinan pola pembalikan secara otomatis.

Bagaimana cara menggunakan:


Dengan mengklik fitur tombol terletak di sebelah kanan atas dari chart, kita dapat mengatur utilitas sebagai berikut:

"SEARCH" akan menemukan semua pola yang mungkin yang akan terjadi selanjutnya.
"NEXT" akan memindahkan titik "D" pada pola yang diperoleh, untuk mengetahui nama.
"ON / OFF" untuk mengaktifkan indikator atau menonaktifkan.
"COLOUR / NONE" untuk mengubah warna dari pola harmonik, yang berwarna atau tidak.
"XABC" untuk menempatkan titik XABC ke terdekat tertinggi atau terendah titik.
"RESET" ketika terjadi kesalahan yang belum ditentukan, tekan tombol ini.
"AUTO" mencari kemungkinan pola berikutnya secara otomatis.
Untuk memindahkan lokasi menu, tekan tombol "M" untuk sementara waktu. Setelah tombol "M" dirilis, klik tombol mouse pada area yang diinginkan.
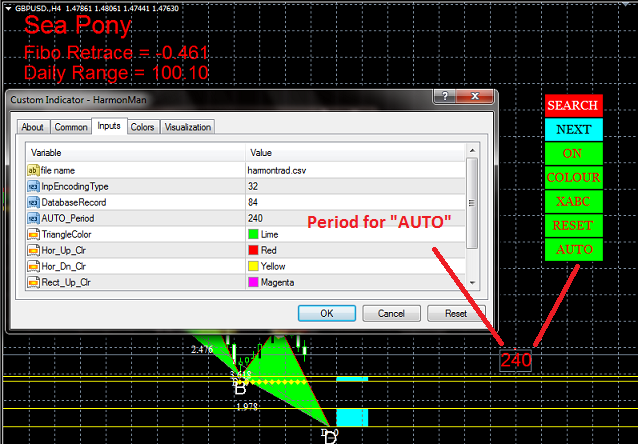
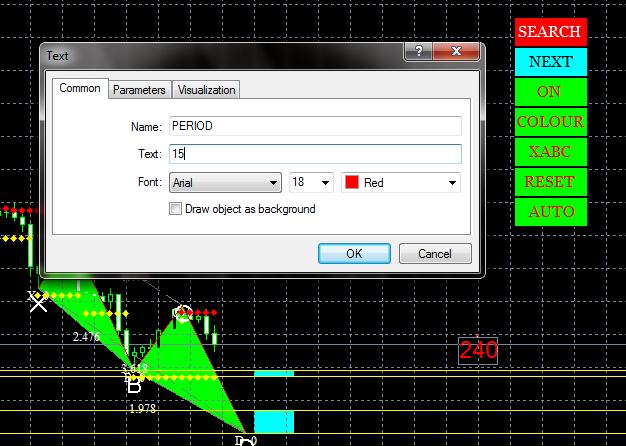
"AUTO", fitur "AUTO" secara otomatis akan membuat objek properti "TEXT" nama "PERIODE" yang menunjukkan PERIODE yang akan digunakan untuk mencari kemungkinan pola pembalikan berikutnya.

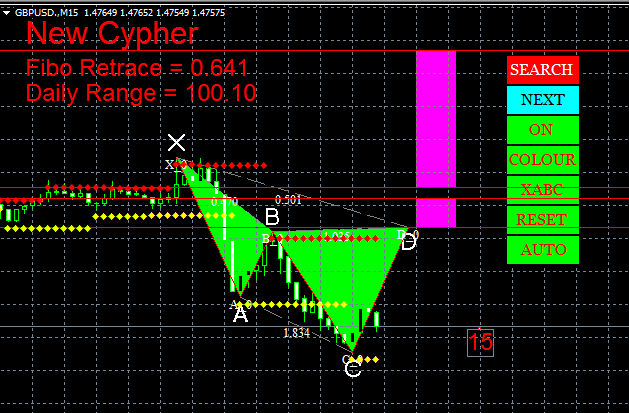
Kita dapat mengubah PERIODE untuk mencari, dengan mengubah objek properti "TEXT" nama "PERIODE" di atas.


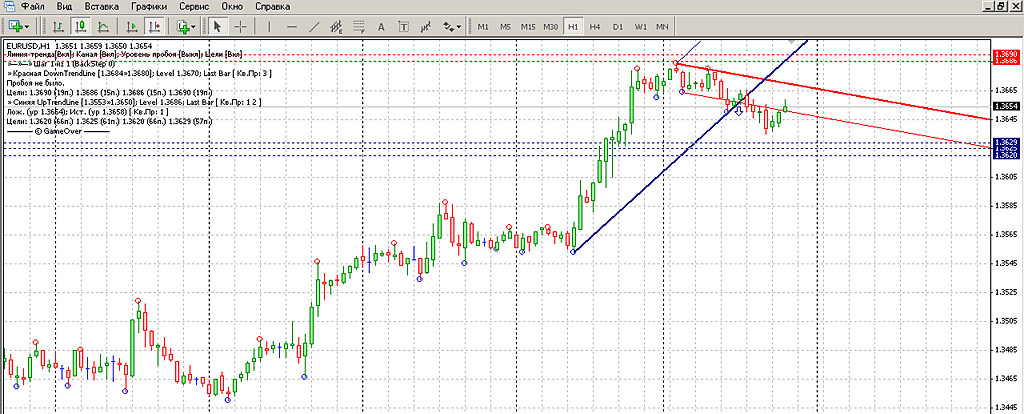
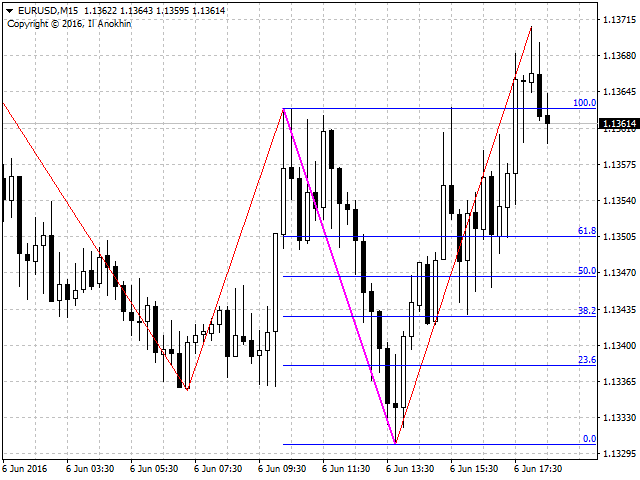
Klik tombol "AUTO" lagi, dan hasilnya akan ditampilkan sebagai gambar di bawah ini. 


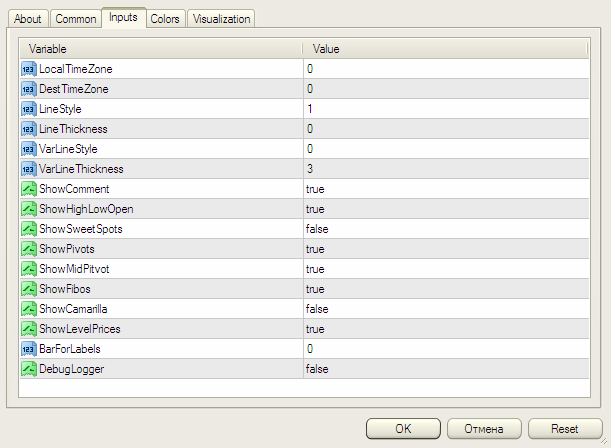
Anda juga dapat mengubah database "Harmonik Pola" dengan database Anda sendiri. Dengan mengubah input "nama file" dan "DatabaseRecord".

Anda tidak perlu khawatir bahwa jumlah didefinisikan dalam "DatabaseRecord" tidak tepat, karena indikator akan menyesuaikan jika angka yang diberikan terlalu besar. Dan hanya akan membaca catatan database, sesuai dengan jumlah input, jika nomor yang dimasukkan terlalu kecil.

Simpan file database Anda di \ MQL4 \ Files.

FiboPivotCandleBar - indikator MetaTrader 4

Deskripsi:
Indikator ini adalah gabungan dari beberapa indikator: Fibonacci, Pivot Point, ZigZag, Stochastic dan Relative Vigor Index, yang digabungkan dalam indikator ini.

Indikator ini memberikan saran untuk membeli dan menjual dengan arah panah.

Update_01 (24/03/2015)
  • Mengurangi sinyal palsu, disederhanakan rumus, dan diganti formula dari indikator Stochastic dengan indikator MACD.


Update_02 (26/04/2015)
  • kode tetap untuk Harga Retracement FiboCandleBar.


Update_03 (18/05/2015)
  • Alerts Ditambahkan (Pesan, Email dan Suara) untuk indikator.
  • Peningkatan kinerja Indikator.


Update_04 (16/06/2015)
  • Ditambahkan Pilihan Warna, sehingga pengguna dapat mengubah bar warna dan warna font.


Update_05 (30/07/2015)
  • Membuat perubahan kecil untuk rumus Pivot.
  • Dihapus variabel yang tidak terpakai.


Update_06 (16/09/2015)
  • Ditambahkan formula untuk meningkatkan akurasi sinyal.

Gambar:
FiboPivotCandleBar indikator MetaTrader 4


SDX-TzPivots3 - indicator for MetaTrader 4

Penulis nyata:
Shimodax

Pengantar:
Perhitungan pivot dan tingkat yang sama berdasarkan zona waktu. Jika Anda ingin mengubah warna, silakan gulir ke bawah untuk baris 200 dan di bawah (di mana dikatakan "Hitung Tingkat") dan mengubah warna. Nama-nama warna yang valid dapat diperoleh dengan menempatkan kursor pada nama warna (misalnya di suatu tempat di kata "Orange" dan menekan F1).

Waktu-Zone Input:
  • LocalTimeZone : TimeZone yang MT4 menunjukkan waktu setempat, misalnya 1 atau 2 untuk Eropa (GMT + 1 atau GMT + 2 siang penghematan waktu). Gunakan nol tanpa penyesuaian.MetaQuotes server demo menggunakan GMT +2.
  • DestTimeZone : TimeZone untuk sesi dari yang untuk menghitung tingkat (misalnya 1 atau 2 untuk sesi Eropa (tanpa atau dengan waktu siang) Gunakan nol untuk GMT.


Contoh : Jika server MetaTrader Anda terletak di EST (Eastern Standard Time, GMT-5) zona dan Anda ingin menghitung tingkat untuk sesi perdagangan London (waktu Eropa di musim panas GMT + 1), kemudian masukkan -5 untuk LocalTimeZone, 1 untuk Dest TimeZone.

Harap mengerti bahwa pengaturan LocalTimeZone tergantung pada waktu pada grafik MetaTrader Anda (misalnya, demo server dari MetaQuotes selalu berada di CDT (2) atau CET (1)), tidak peduli apa jam di dinding Anda mengatakan.

Jika ragu, meninggalkan segala sesuatu ke nol.

gambar:

EURUSD.f, H1: Pivots (SDX-TzPivots) 3

EURUSD.f, M30: Pivots (SDX-TzPivots) 3


Tips:

  • BarForLabels = jumlah bar dari kanan, di mana garis label akan ditampilkan.
  • Komentar untuk sudut kiri atas: Range, Highs, Lows, Tutup - Kemarin, Hari ini.

Baru:

  • VarLineStyle
  • VarLineThickness

iPivot - indikator MetaTrader 4

Deskripsi: 
Namun indikator Pivot Point lain tapi itu sedikit berbeda. Pilih Anda poros rumus disukai: Standard, Fibonacci, Camarilla, Woody dan DeMark dengan 4 Dukungan dan garis Resistance.

rumus iPivot Fibonacci iPivot rumus Standard rumus iPivot Woodie pengaturan iPivot

Fitur:


  • Sederhana dan bersih garis Trend.
  • Pemberitahuan: Alert, Email, Suara berkas.
  • Perhitungan Auto Minggu.
  • Menyesuaikan garis gaya, warna dan lebar.


  • Penyangga:
  • Buffer 0 - Pivot Point
  • Buffer 1 - Perlawanan 1
  • Buffer 2 - Resistance 2
  • Buffer 3 - Resistance 3
  • Buffer 4 - Resistance 4
  • Buffer 5 - Dukungan 1
  • Buffer 6 - Dukungan 2
  • Buffer 7 - Dukungan 3
  • Buffer 8 - Dukungan 4

  • Arrows & Curves - indicator for MetaTrader 4

    Author: lukas1

    Arrows and Curves indicator


    T3 Taotra - indicator for MetaTrader 4

    T3 Taotra Indicator